
Doomsday by Numbers
All data compiled on 3rd February 2018.
Decks not hot.
DDFT is international now fam.
Check the statistekks. (?)
The Data Collection
Back in January I posted an article detailing a bit about DDFT as a deck across the course of 2017 and how it is fairing now. I presented some statistics that had been gathered and gave a hint that another article was coming where I present them properly and in greater detail.
This is that article.
Back in November some of us started trying to actually work out how well the deck was performing. We had gone through a tricky year with the Sensei's Diving Top ban and as a result many people were changing many things in their lists with no real idea of how performance was going. To help work this out we started a public data collection sheet to facilitate working out a variety of stats. A lot of influence for what data was to be gathered stemmed from the equivalent data sheets and statistical work by Bryant Cook of TES fame.
There are some key differences in how we have collected certain things. It was assumed that DDFT of the three storm decks (ANT, DDFT, TES) was the slowest and therefore unlike ANT/TES, we wanted to record combo turns up to T5+ as opposed to T4+. The reasoning behind this is that T4 can often represent a combo turn on T3 where the pilot has identified a piece of permission they must play around or similar. Despite this difference in raw data for any direct comparisons to the ANT/TES data we have converted the results so that it's all incorporated into the T1-T4+ format.
Winning game engines was another difference. We could have just tracked Doomsday vs Empty the Warrens vs Natural Tendrils kills however this wouldn't have been enough detail. Doomsday itself is a weird deck, once you cast the card there are so many different ways to draw into it, time it, win with it that you have a lot of different options. In total we have 35 different generic winning engines used spread across the use of Doomsday, Burning Wish and the various win conditions that can be utilised. We also tracked whether a combo turn involved a pass-the-turn pile, a double cantrip pile, and various other techniques with cards like Laboratory Maniac or Conjurer's Bauble.
Going into this level of detail allowed us to identify trends in how often the deck uses what to win and how useful certain niche cards are to the deck.
Bias Within the Data
There are some limitations with how our data is compiled and assessed. One major one is in regards to combo turn. Combo turn refers to the turn we "go off" but this may not be the same turn we win. Casting Doomsday on T1 to build a Shelldock Isle pile would still be recorded as a T1 combo turn despite not winning until T3/4. The same with early EtW plays. Making 14 Goblins on T2 might not win you the game until T4 or even later but it would still be recorded as T2. The TES data has this same issue in regards to EtW lines but with Doomsday and pass-the-turn piles it's possibly a bit more prevalent here.
Another major difference in the data collection compared to Cook's TES data is that the TES data only draws from a single individual and only records MTGO Leagues or Comp REL paper events. We decided to be a bit more open with our data collection compiling it from a large number of individuals at various experience levels with the deck, and from various types of events. This also includes practice games, testing, local Paper events, Xmage and Cockatrice games. Despite some of the stigma associated with some of these mediums they are all valid matches played in a competitive fashion so should be counted. It also allows us to generate the most amount of data points to try and avoid individual or medium biases so that the deck's performance is the focus irrespective of skill level or experience.
The final main limitation is what decklists people are running. DDFT has a core series of pieces however unlike a lot of decks, there are a lot of 'flexible slots' available in terms of numbers of Burning Wishes, Lotus Petals, Lands, having BR duals vs all UR duals, whether you run Rain of Filth, Conjurer's Bauble, Preordain, how many discard spells you run and at what ratios of each and splash colours. Because of this variance it's hard to determine what list is performing best. We could try at give each ratio of things a unique code slot and string them together just as we could try and get people to list all cards in their piles however people don't want to have to keep that level of detail in their notes so in the interests of pragmatism this level of data is ommitted.
Business Business Business. Numbers, Numbers, Numbers
Right then, let's start looking at some data shall we?
First of all the number of total 'good' match data points is 565. A good match is defined as one where we have all the pertinent information recorded. For any data crunching involving sucess or win% we shall also define a 'good' match as "not the mirror". The reason being here is that we might only have data from one side of the match therefore only recording the result from one side and not the other. As a result it's easier to just omit them than allow the minor skew from it to be used. So for any results based statistics we had 560 data points instead (yes, that means 5 mirror matches played, funtimes!).
Winning
First of all the ones that everyone wants to know: the match and game win rates.
Match win rate: 56.25%
Game win rate: 54.71%
Well it's positive (>50%)! That's always a good start.
What does this actually mean though?
Well it means that we have a better than half chance of winning any given match against a 'normal' metagame at least at face value. As you can see we have some interesting points in regards to the fact our game win % is lower than our match win % and this will become more apparent as we go on. Long story short is that we are favoured to win the less games we play. Most of our wins are 2-0's and most of our losses are 1-2's.
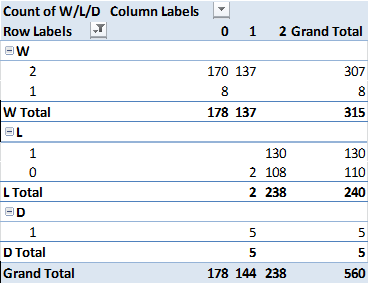 Ratio of wins table
This is further justified when we look at our Match win % when we go to a game 3 compared to when we do not.
Match win rate win in two games: 61.62%
Match win rate win in three games: 50.54%
Looking further in again to a win % breakdown by game, we can see the trend even clearer:
Game 1 wins: 61.15%
Game 2 wins: 51.64%
Game 3 wins: 50.74%
So why is this?
It might be that many of our opponents have relevant sideboard choices against us. It could also represent them incorrectly sideboarding and realising their choice was wrong for game 3. A great example of this would be bringing in Grafdigger's Cages or similar, then realizing that grave hate is generally ineffective. It could also be related to the fact that the archetype has quite a few unknown cards which our opponent's might not know how to interact with but, as the match goes on, will get used to. It might also be our own constraints in sideboard options. Being a combo deck, and a combo deck that uses a wishboard at that, we do have limited slots and options for trying to face a large variety of hate in different forms and it may be often we just have the wrong answers at the wrong times. It could also be the fact that our main win condition allows our opponent to see the entierity of our deck that is not included in the Doomsday pile and thus know exactly what to play around.
Pre-release edit:
I had in fact pre-written a lot of this article before copying in the numbers as the trends were already seemingly well developed however something was interesting to note here. When I first started writing this up G3 was at a negative win% (around 45%) however when coming to review the article we realised that it was now at 50%. This is really interesting as it implies that, over the course of the past month or so, we as an archetype and as pilots have obviously started figuring things out. My personal hypothesis is that we, having finally worked out where the deck is going have now been able to focus outwards at the person across the table and not just inwards in trying to get the deck to work. This change over time is about to be discussed next anyways but I thought it was an interesting enough point to mention.
About Time
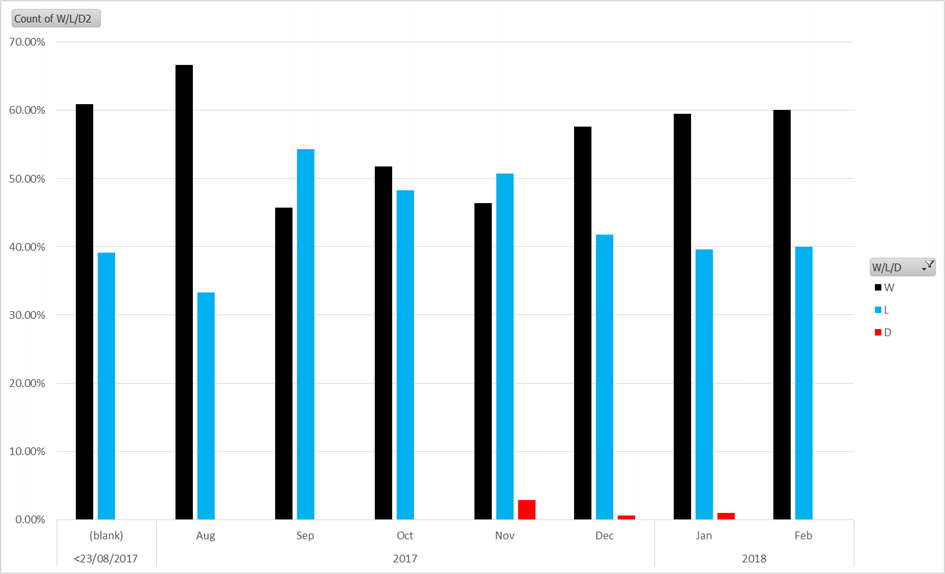
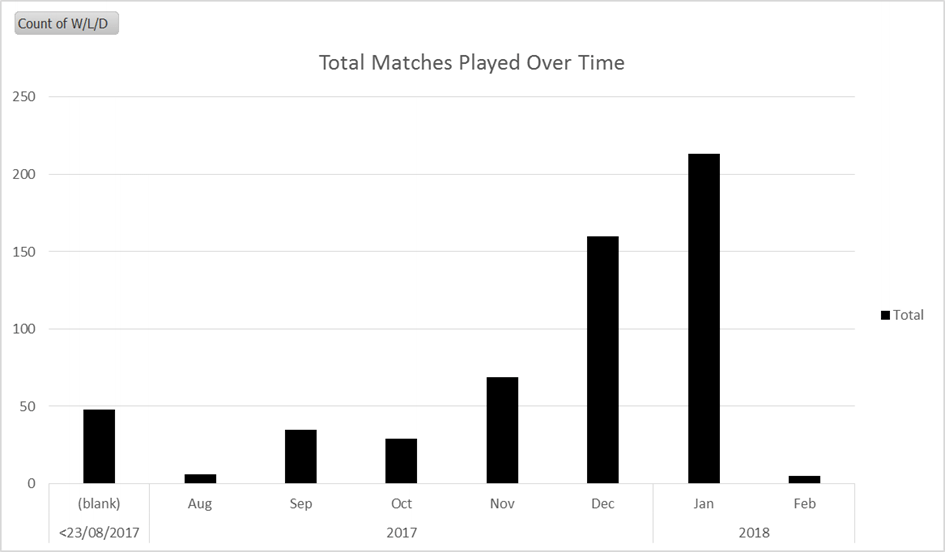
Backtracking a tad, the overall Match Win % is not static however. We have been trending it over time and, although we have only recently started gathering data, we can already see some trends for the better. Below shows the Match Win % over time; I have also presented the number of matches played over time to allow you to get a feel for how significant each month's result is in terms of consistency.
 Winrate over time
 Number of matches over time
As you can see with have limited early data but a lot more recent data. We can also see an upward trend in terms of Match Win %. If we look at Match Win % but only taken from the past two months we get:
match win rate win past two months: 58.67%
Definitely looking better.
So why is this improving? I personally thing it's to do with consistency. Previously between April (Top ban) and around late October there was little agreement between pilots who talked things through about what to run. Many lists were tried in order to work out where the deck was going and whether it was still viable, and though there was some early success, those lists tended to vary wildly. As touched on in my last article a lot of experienced people also put down the deck and though it still attracted newer pilots, a lot of the experience was lost and those who remained had to re-learn a lot of things and get used to playing the deck without Sensei's Top.
Part of this also might be the widespread accepted use of Conjurer's Bauble as a card. The innocuous little artifact has a lot of potential and some key niche uses for the deck. Some people had started to use it but it wasn't until g0ld_rook's 5-0 league online being reported that people started to adopt it a lot more. It might be unrelated to this addition but that is one of the few decklist additions we can track with relative certainty mainly through discussions between pilots.
The Other Side of Things
Obviously one thing we can consider in how a deck is performing and it performs over a given period of time is the opposition that the deck will face. Despite what some people might say, there is no deck that has good matchups against every other deck. That is the beauty of the game and of the format, there is something to prey on and be hunted by. If I were to go into a room and be told I was playing against Elves and Lands I would be very happy. If I was told it was Eldrazi and Force of Will/Hymn to Tourach/Ethersworn Canonist.dec then I would be less so.
First of all let's take a moment to appreciate the variety of the format. Across the results we have a total of 97 different decks which is great. We did go through the results and tidy up certain decks where minor naming coventions might give the illusion of difference but they are the same for all intents and purposes (Dragon Stompy and Goblin Stompy). I'm sorry if by doing this I offend any archetypes however sometimes key subtle differences are just too subtle. The highest represented deck across all our results only had a net share of 9.04% of the meta we have faced so far which is nice.
Now if we were to split our dicussion for each deck we would have a hard time
and this would be a much longer article (though it is pretty long anyways so
thank you if you have made it this far). Often when talking about archetypes
people will split them into 'Blue' and 'Not Blue'. Sometimes this binary system
gets broadened by the addition of 'Chalice' however this then asks the question
of where does Popeye stompy circa 2017 fit in being both
'Blue' and a 'Chalice' deck?
Poor taste jokes aside we decided we wanted to try and define what we were
facing by more than just whether they had a colour associated with them but less
than listing each and every archetype.
We decided upon a system of defining archetypes by what elements we as a deck actually cared about in terms of interaction. We decided to use the following catergories to list archetypes by:
- Chalice - Decks that utitlize permanent, usually artifact based hate such as Chalice of the Void or Thorn of Amethyst
- Counterspells - Decks that utilise reactive countermagic such as Force of Will or Daze
- Discard - Decks that utilise proactive hand disruption such as Thoughtseize or Hymn to Tourach
- Hatebears - Decks that usitilise creature based disruption such as Thalia, Guardian of Thraben or Eidolon of the Great Revel
- Speed - Decks that just try and kill you quickly
Of course we then also added sub categories of the combinations of the two so Doomsday as a deck would come under the heading of 'DiscardSpeed'. We did not go for combinations of three because it did not seem pertinent. Only a few decks run a mixture of three of these items (Esper Stoneblade/Deathblade) and of those two are normally more prevalent than the last. Assigning these labels this way grouped interesting things together.
Despite one being a great matchup and the other being unfavorable, both Eldrazi and Lands come under the heading 'Chalice'. Eldrazi because they run Chalice of the Void in the maindeck and Lands because their main method of hate is bringing in Sphere effects from the sideboard. Pretty much all storm variants come under 'DiscardSpeed' but so does BR Reanimator. There are definately limitations to this assigning method and I would be very open to a different way of doing it.
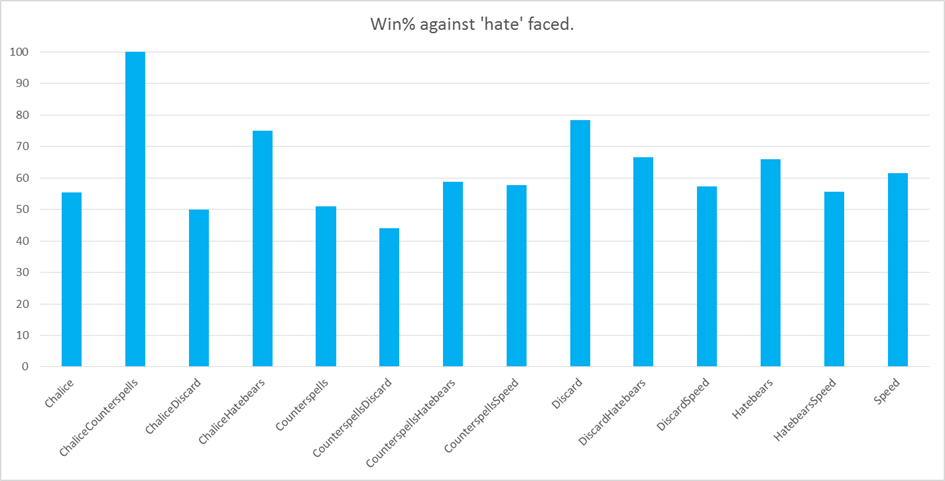
Looking at the performance breakdown against our categories we get this results display:
 Winrate against hate
We seem to have a pretty good set of matchups despite the differing hate types however one result is really key in showing how the deck's performance is in this current meta. 'CounterspellsDiscard' is representative of two of the biggest decks in the format right now. Grixis Delver and Czech Pile. We obviously need to try and up our game against these decks however facing a mix of proactive disruption to your hand and reactive countermagic for the combo whilst under pressure is tricky. These are also the category the two highest opposing decks fall into accounting for 16.82% of the meta between them. The ChaliceCounterspells result can be largely discounted due to small sample size, since few decks (mainly Tezzeret lists) run this combination of interaction.
Just going by the numbers it looks like if we can improve these two matchups specifically then our overall performance rating should increase. The trick is figuring out how to achieve that improvement...
Mulling Over Things
In my previous article I already showed how the deck mulligans well but let's look into it a bit closer. Again I will present below the graph of percentage of times we keep starting hands and how often we win with said starting hand numbers.
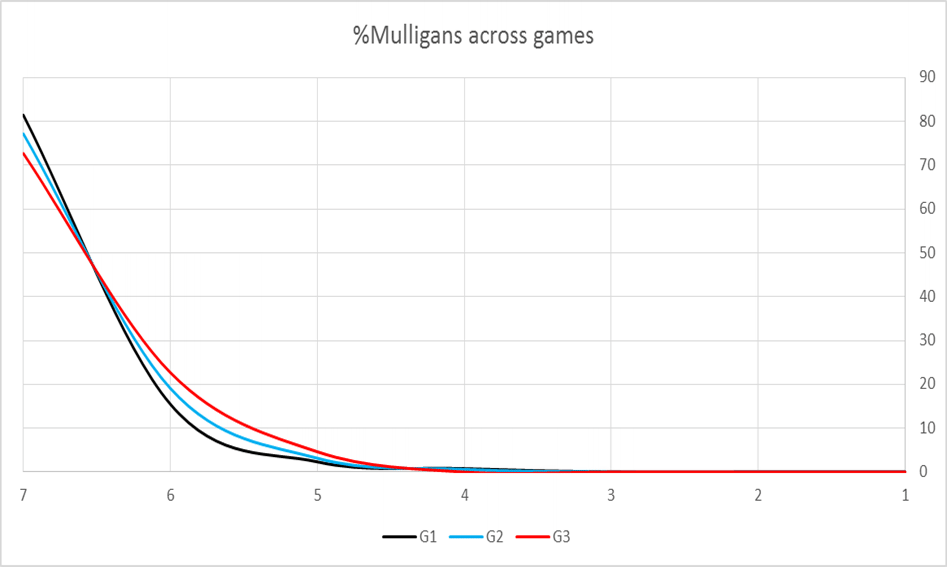 Mulligans across games
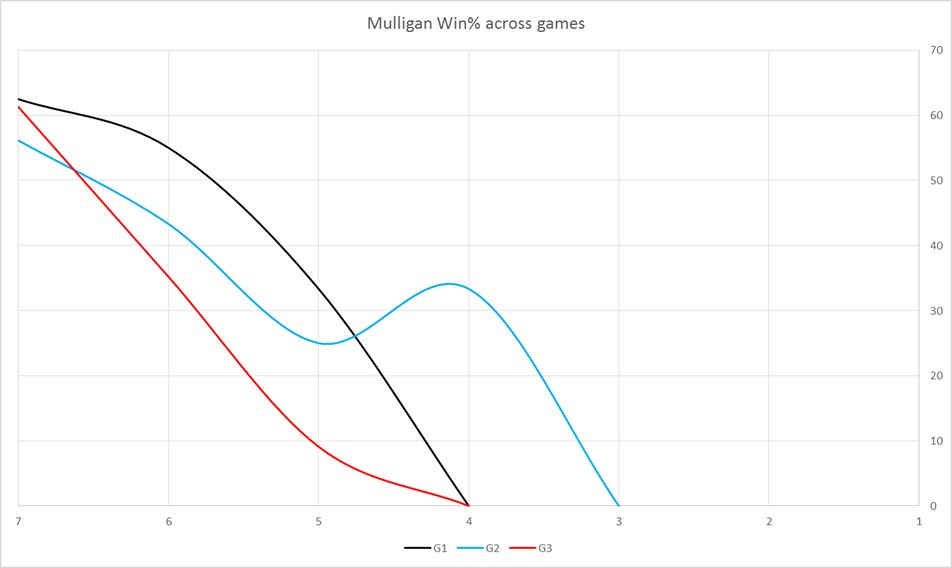 Winrate based on mulligans across games
As you can see we keep seven card hands pretty consistently. Interestingly enough, the rate at which we mulligan seems to definitely follow a trend as games go on through a match. This could be because of awareness of opposing deck and what constitutes a good hand against a given opponent or it could be more aggressive mulliganing to try and find key sideboard elements. Looking at the win % based on starting hand we continue to see a drop in win percentage across all starting hand sizes. Given the higher penchant for needing to mulligan this might help explain the lower game 3 win % or it might be a result of it rather than a contributing factor.
Either way it looks like the deck mulligans pretty well.
Gotta go Fast
The next thing to look at that I touched upon previously is the speed that we go off. This is an interesting one as discussed because it's hard to get an accurate representation of speed without fudging numbers or recording exactly what turn you combo off in. For reasons already mentioned the speed of the deck was tracked as the turn that the deck "went off" that is to say completed their combo (whatever combo that was). This includes casting Doomsday to win that turn, casting it to initiate a pass-the-turn pile, delivering a lethal natural Tendrils kill or creating a number of goblins via EtW.
The scale was tracked from turn 1 (T1) to turn 5+ (T5+) and is recorded as a percentage of across all games.
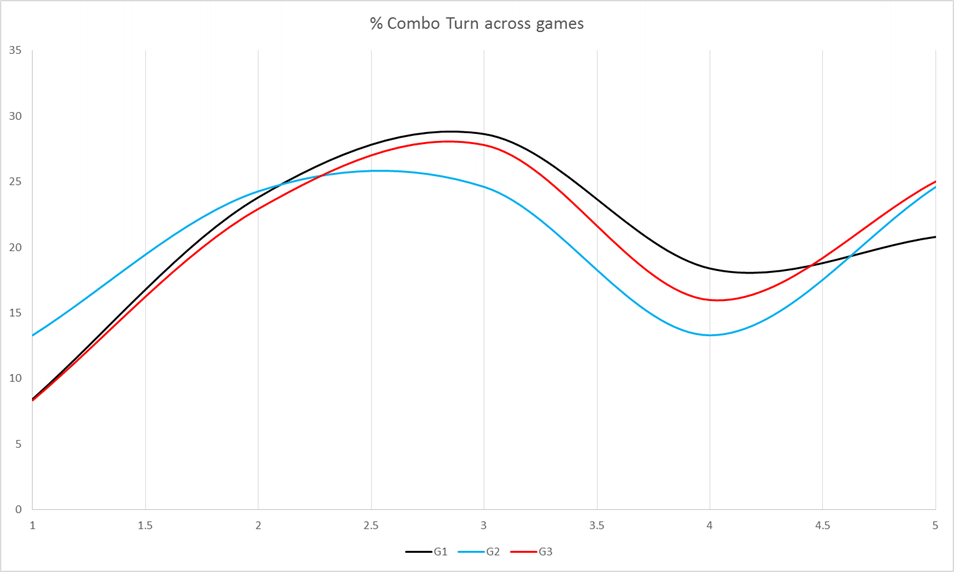 Combo turn across games
Those are some nice curves no?
Already we can see some interesting observations. Game 1 seems to have the most
consistent setup with high percentages of T2 and T3 combo turns. Game 2 seems to
show the highest variance with the highest percentage of T1 combos but also a
high number of T5+ combos. Let's look more closely at the averages of this
graph.
Totalling all combo turns across all games together and applying the TES T1-T4+ scale we can work out our overall Average Combo Turn (ACT).
ACT: 2.94
Comparing this to the other data from the last article we can see we are slower
than TES on average but marginally faster than ANT. One thing to note however is
that we do record combo turns for games even when we do not win them. This
represents us 'going off' and maybe being blown out by an unknown piece of hate
or miscounting storm or messing up the pile. To fix this we can generate the ACT
filtered only by when we win the game we go off.
Averaging that gives us the following:
ACT (wins): 2.92
As you can see it is in fact slightly faster. I think this can be easily explained by the fact that as any game drags on, the non 'fast' combo player is more likely to draw into resistance or answers and apply more pressure at the same time.
Finally we shall check what happens for only winning lines that use Doomsday as the engine card. This is to help get an idea of how many results are being skewed by fast EtW engines being used. Again this is only for games that we win and only where Doomsday is part of the engine used:
ACT (wins, Doomsday): 2.96
Unsurprisingly it is slower than the overall wins ACT however it is still faster than the total ACT compiling all combo turns that include losses. I think all this shows that overall we are a fast enough deck to be considered fast combo (relative to the other storm variants and not including things like Belcher or BR Reanimator).
One thing to consider about the Doomsday only wins number and the others before it is that pass-the-turn Doomsday lines can also skew the data to seem faster than it is. Let's take this as an oppotunity to look at roughly what amount of our total Doomsday lines are pass-the-turn ones.
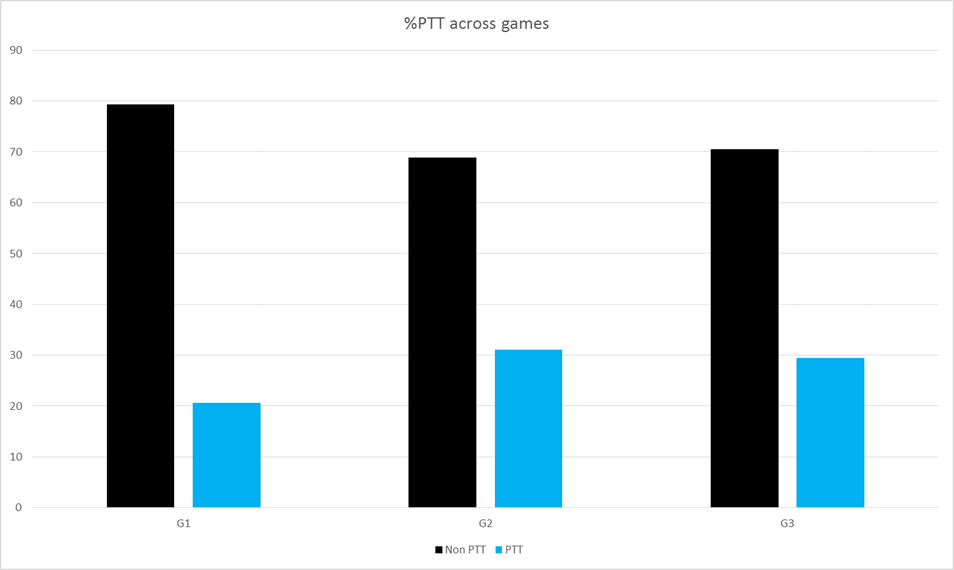 Ratio of pass-the-turn piles
Game 1 only 20% of play lines are pass-the-turn. Games 2 and 3 this increases to 30% which is interesting. This could be an increase of usage of Shelldock Isle or of Jamming T1 Dark Ritual into a T2 Laboratory Maniac kill against decks that can't effectively interact with that plan early on. It could also represent the need to go off in the face of more constrained resources preventing a same-turn win.
How we do Things
Following on from our glance at how often we pass-the-turn we can also see what methods we use to win. We asked people to fill in their winning line from a pretty comprehensive list of different methods but for easy viewing we have broken it down into a set of four.
- DD: Any line that wins via the casting of Doomsday
- EtW: Any line that wins via the casting of Empty the Warrens (without casting Doomsday)
- N-Storm: Any line that wins via just naturally storming our with Tendrils of Agony (without casting Doomsday)
- Other: Any other win method such as sideboarded Man Plans or Burning Wish for Telemin Performance
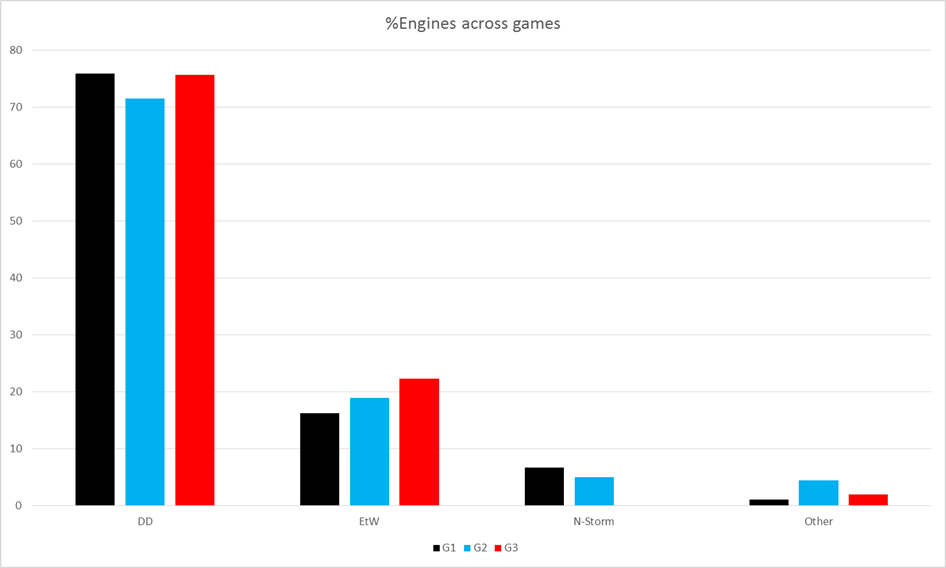 Winrate per engine across games
Doomsday lines are a clear majority in terms of winning engine accounting for three quarters on average of our total lines. Next is Empty the Warrens lines resulting in roughly eighteen percent of lines. Natural Tendrils comes in at a strong five percent or so and 'Other' a neat two percent. If nothing else, it's nice to see how significant the namesake card is as a win condition in a deck that has a lot of potential options for play.
Delving into the Doomsday lines themselves we have another split between the main three win conditions.
- ToA: Doomsday stacks resulting in a lethal Tendrils of Agony
- LM: Doomsday stacks resulting in winning from a Laboratory Maniac
- SI: Doomsday stacks winning by casting Emrakul, the Aeons Torn off of Shelldock Isle
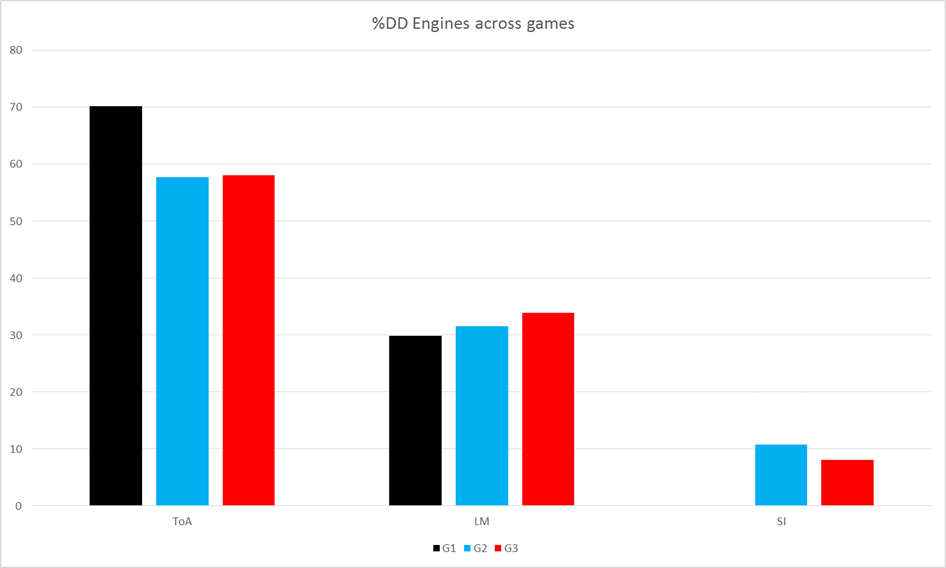 Doomsday piles across games
Lethal storm is again a clear majority, especially in Game 1. Laboratory maniac is steady across all games accounting for around thirty percent. I know some people debate on whether the inclusion of maniac is worth it but from this data it seems to show that he represents almost a third of wins therefore should probably be included. What is interesting is that the reduction in storm wins from Games 2 and 3 seems to go directly to the added presence of Shelldock Isle wins.
Closing Thoughts
I didn't think I would get so into this whole stats thing but I did. I'm normally a Han Solo, don't tell me the odds kind of guy so following numbers was a refreshing change. I'm hopeful that the above helps solidify our position as an established deck despite a lack of metagame penetration and / or number of top 8 performances (give us time!). It seems we are doing pretty well and now just need to start polishing up our gameplay and bringing out our anti-CounterspellsDiscard tech (IMO it's two Empty the Warrens in our board).
Massive shout outs to all those who have contributed results to this project especialy d8dk32 and Hulahula who are MTGO League Machines! All I ask is that everyone keeps up with the data recording. The more we keep up with this, the more results, the more accurate a snapshot we can keep on how the deck is performing.
For more content, please check out our resources page which includes a list of community streamers. If you would like to submit content to the Wiki, feel free to reach to us in the Doomsday Discord.